If you are trying to make sense of South Miami home prices, you are not alone. Rates move, inventory shifts, and certain blocks seem to trade at a premium while others sit. It can feel noisy when you just want clear answers. This guide breaks down the local forces that matter, the neighborhoods and features that move price per square foot, and a simple checklist you can use to track the market with confidence. Let’s dive in.
Mortgage rates and demand
Mortgage rates are a big lever on affordability. When rates climb, buying power drops and demand can cool. When rates fall, more buyers step in and competition can rise. You can follow weekly trends on the Freddie Mac Primary Mortgage Market Survey to see how financing conditions are shifting.
The key for South Miami is how rate moves intersect with local inventory. In a tight‑supply neighborhood, even a small drop in rates can lead to multiple offers on well‑located homes.
Inventory and supply signals
Inventory tells you who has the upper hand. Low months’ supply tilts toward sellers and supports higher prices. Rising supply gives buyers more options and leverage. For current counts and months’ supply, check the MIAMI REALTORS market data. Pair city‑wide trends with a neighborhood view, since micro‑markets can behave differently block to block.
Watch three things:
- New listings versus under contracts each month.
- Days on market for homes like yours.
- The list‑to‑sale ratio drifting closer to 100 percent or widening below it.
Who is buying in South Miami
South Miami draws a mix of end users, investors, and some foreign buyers. Young professionals and households connected to the University of Miami and Coral Gables employment centers are common. Cash buyers also show up in Miami‑Dade, which can influence speed and price outcomes.
The buyer mix matters because it shapes demand for specific property types. Condos near transit and Sunset Drive attract smaller households and investors. Larger lots with updated single‑family homes often draw move‑up buyers who want space and proximity to retail.
Housing types and price gaps
South Miami’s housing stock is diverse, which explains the wide range of price per square foot.
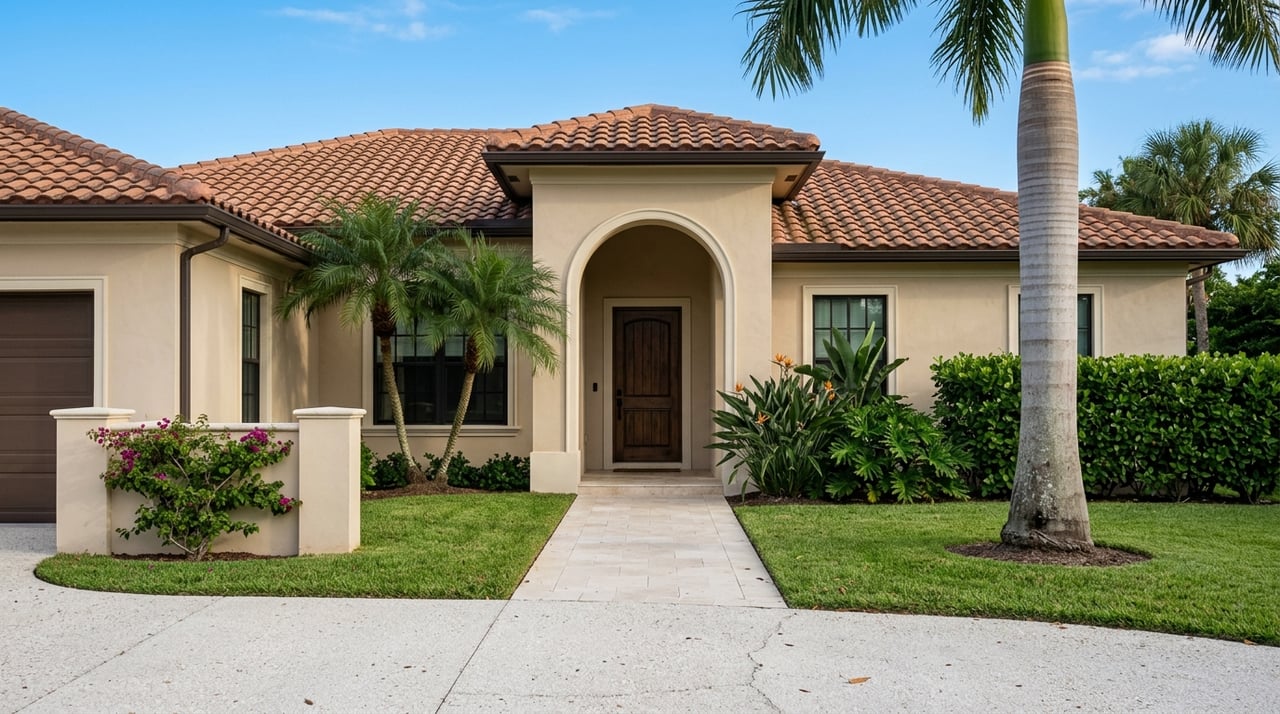
- Mid‑century single‑family ranches and bungalows. These often offer good lot sizes and walkable access to shopping, but many need renovation. Entry price can be lower, with upside after improvements.
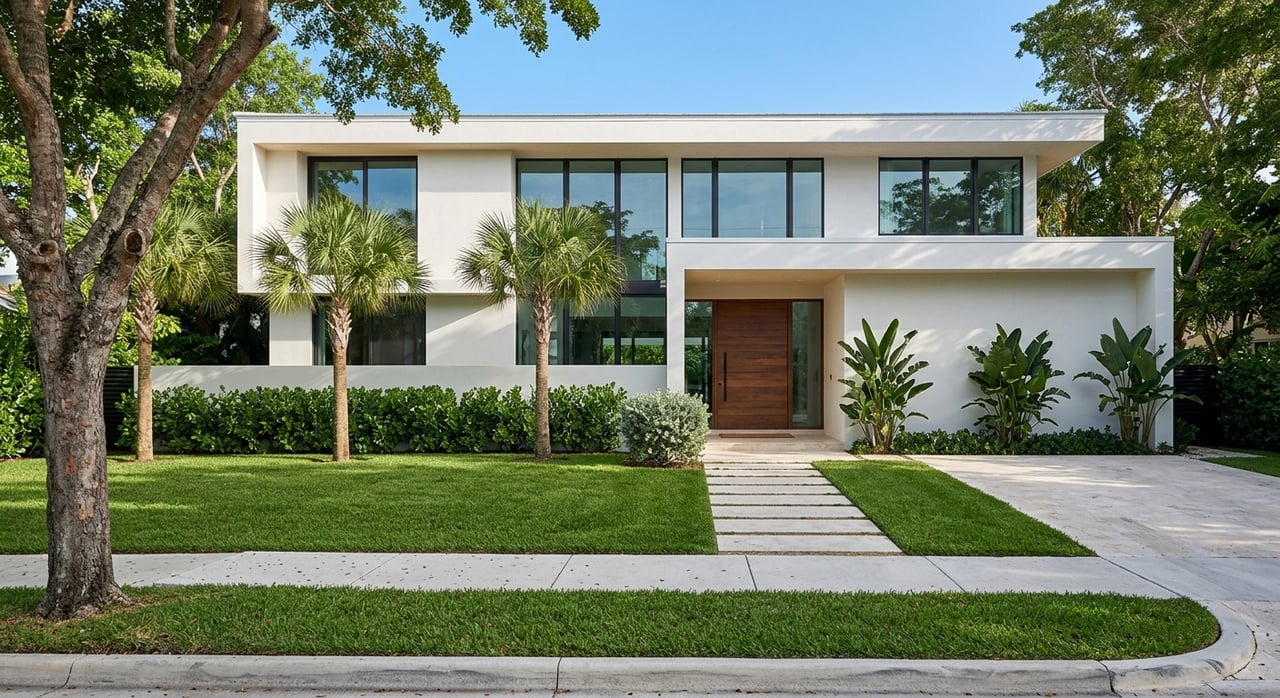
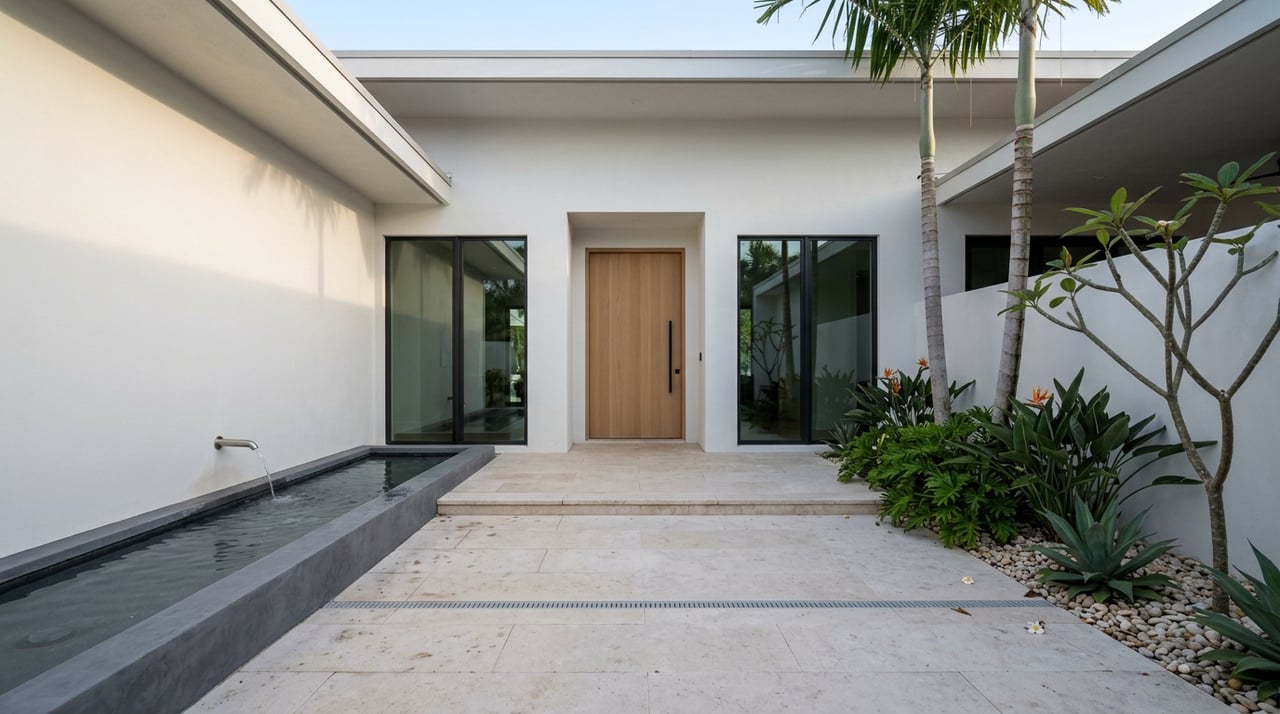
- Newer infill single‑family homes. Tear‑downs replaced with larger modern builds command a significant premium for square footage, layout, and finishes.
- Low‑ to mid‑rise condos and garden apartments. These cluster near US‑1, Sunset Drive, and transit. They appeal to students, faculty, and small households.
- Townhomes and small multifamily. These appear as infill options and provide middle‑ground pricing and maintenance.
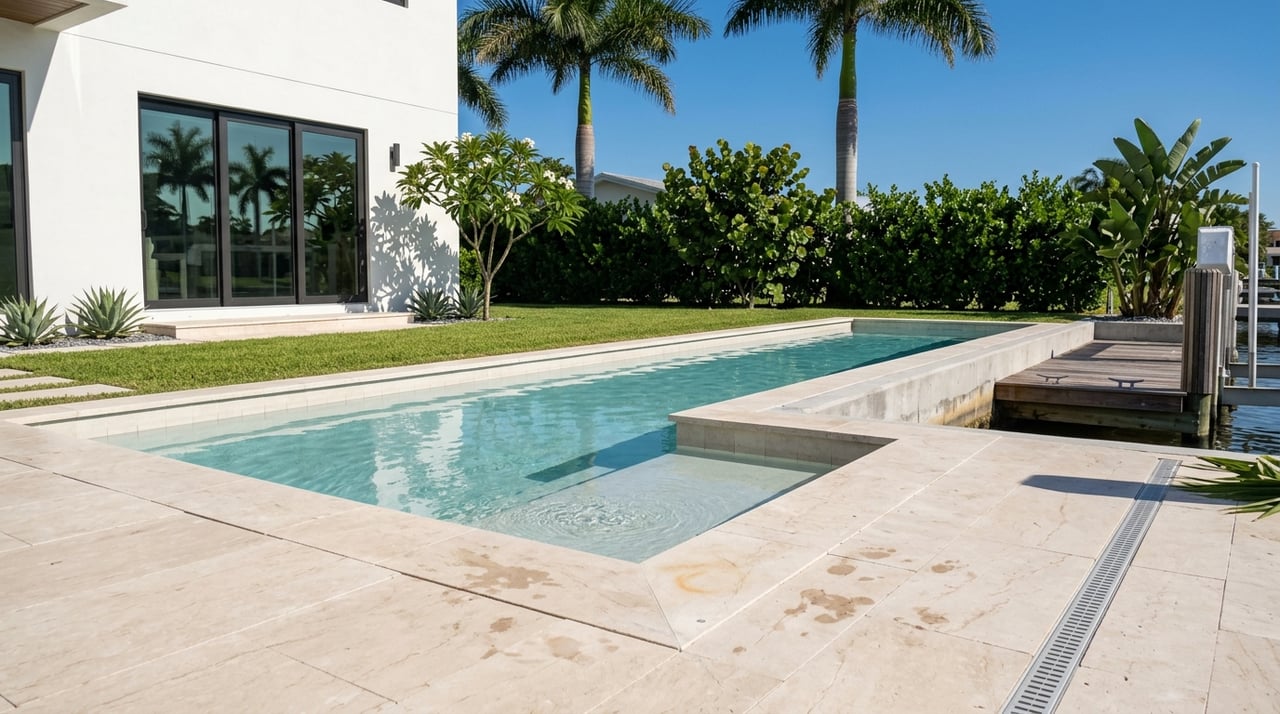
Newer builds and full‑gut renovations usually sell higher than updated mid‑century homes on the same street. Larger lots and mature tree canopy also add value, especially for buyers prioritizing outdoor space.
For a sense of the area’s housing age and general stock mix, you can browse the U.S. Census tables for Miami‑Dade on data.census.gov.
Transit proximity and price
Two features consistently support stronger pricing in South Miami: Metrorail access and University of Miami proximity.
- Metrorail. Homes and condos within a short walk of South Miami Station or University Station often show a premium relative to similar properties farther away. Proximity tends to help price per square foot and days on market, especially for condos and smaller homes. See station locations on the Miami‑Dade Transit map.
- University of Miami. Students, graduate students, faculty, and staff create steady rental demand, which underpins investor interest near campus. If enrollment or campus projects expand, nearby demand can strengthen. You can track enrollment trends through UM Institutional Research.
To quantify the premium for your property, compare recent sales within 0.25 to 0.5 miles of a station or the campus with sales 1 mile away, adjusting for size and condition.
Sunset Drive and walkable pockets
Walkable retail and dining help values because they add daily convenience. Blocks close to Sunset Drive and the Shops at Sunset Place corridor often trade faster and higher than similar homes farther out. The same goes for streets that offer both quiet residential feel and quick access to Coral Gables amenities.
Seasonality and timing your move
Miami’s market has a seasonal rhythm. Spring tends to be the busiest window with more listings, showings, and multiple offers on stand‑out properties. Summer remains active, especially for families timing a move between school years. Fall and winter can be slower overall, though seasonal visitors can add steady demand in some segments.
List‑to‑sale ratios often tighten in late winter through spring. To see timing in real numbers, track rolling 30‑, 60‑, and 90‑day trends for your specific neighborhood using MIAMI REALTORS market data.
Costs and risks to factor in
Effective cost of ownership is not just your mortgage. In Miami‑Dade, flood exposure, insurance, and taxes can change the monthly math and future resale value.
- Flood and storm risk. Confirm a property’s flood zone on FEMA’s official maps and, when possible, review elevation. Flood zone updates can affect insurance requirements and long‑term value. Check the FEMA Flood Map Service Center.
- Insurance availability and premiums. Florida’s insurance market has seen volatility, with changes in private carrier availability and premiums. Review current quotes and carriers’ appetite for your property type through the Florida Office of Insurance Regulation.
- Property taxes and assessments. Millage rates, municipal assessments, and exemptions all influence carrying costs. Use the Miami‑Dade Property Appraiser to review parcel tax history, exemptions, and recent sales.
If you plan renovations, build in time and cost for permits and materials. Permit timelines can affect both value‑add projects and resale timing.
How to read micro‑markets
Every block tells a story. Here are four recurring micro‑areas to watch in South Miami:
- Transit‑proximate blocks near South Miami and University stations. Expect stronger condo demand, faster absorption, and a walkability premium.
- Sunset Drive corridor and adjacent residential streets. Walkability and retail access support price per square foot.
- Older ranch clusters with tear‑down activity. New builds reset values on a block, lifting the ceiling for renovated homes.
- Small condo pockets near UM and shopping. Investor and student demand influence pricing and turnover.
Use comparable sales within 0.25 to 0.5 miles and the last 3 to 6 months to anchor value. Adjust for lot size, year built, level of renovation, and distance to transit or Sunset Drive.
Practical checklist to track prices
Use this checklist to monitor pricing pressure and make timely decisions.
- Inventory and months’ supply. Why it matters: balance of power. Where to find it: MIAMI REALTORS and local MLS.
- Median list versus sale price and list‑to‑sale ratio. Why it matters: negotiating strength. Where: MIAMI REALTORS and MLS.
- Days on market trend. Why it matters: buyer urgency. Where: MLS and broker reports.
- New listings per month and absorption. Why it matters: fresh supply. Where: MLS, MIAMI REALTORS.
- Share of cash sales and investor activity. Why it matters: demand depth and speed. Where: MIAMI REALTORS and county records.
- Price per square foot by property type. Why it matters: apples‑to‑apples comparisons. Where: MLS comps and the Miami‑Dade Property Appraiser.
- Recent comps within 0.25 to 0.5 miles. Why it matters: most reliable signal. Where: MLS, Property Appraiser.
- Flood zone and elevation. Why it matters: long‑term cost and resale risk. Where: FEMA maps and the Florida OIR for insurance context.
- Transit and UM proximity. Why it matters: measurable premiums. Where: Miami‑Dade Transit and UM Institutional Research.
- Building permit activity nearby. Why it matters: signals of redevelopment and rising ceilings. Where: city permitting portals.
- Mortgage rate trends. Why it matters: affordability. Where: Freddie Mac PMMS.
A simple path if you are buying
- Define your must‑haves. Lot size, layout, distance to transit or Sunset Drive, and renovation tolerance.
- Get clear on flood and insurance early. Request elevation info and insurance quotes during due diligence.
- Price using hyper‑local comps. Focus on the last 90 days within a 0.5‑mile radius for your property type.
- Move fast on stand‑out listings. In low inventory pockets, strong homes do not linger.
A simple path if you are selling
- Time the list date with local momentum. Late winter to spring often supports stronger list‑to‑sale results.
- Lead with presentation. Buyers compare by photos, floor plans, and outdoor space. High‑quality marketing sets the tone.
- Price to the market you have. Use fresh comps, current days on market, and buyer demand signals rather than last year’s headlines.
- Prepare for inspections. Mid‑century homes can have repair items that affect negotiations. Pre‑listing checks reduce surprises.
Bottom line for South Miami
South Miami prices move with rates, inventory, and the premiums tied to transit and UM access. Walkable pockets near Sunset Drive and tear‑down blocks seeing new construction often reset price ceilings. At the same time, flood zones, insurance, and taxes shape the real carrying cost and future resale value.
When you align these factors with solid neighborhood comps, you can price with confidence and act at the right moment. If you want a data‑driven read on your street and a plan tailored to your goals, connect with faustino diaz for a personalized home valuation.
FAQs
Are South Miami home prices rising right now?
- Check recent median sale price trends and inventory in the MIAMI REALTORS market data and compare the last 3 months with the prior quarter to see direction.
How much does being near Metrorail add?
- Compare sales within 0.25 to 0.5 miles of South Miami or University Station against similar homes 1 mile away using price per square foot and days on market from local comps.
Does University of Miami proximity affect value?
- Yes, steady student and staff demand supports nearby pricing; monitor enrollment trends via UM Institutional Research and compare close‑in comps to those farther out.
Should I buy a mid‑century ranch or a new build?
- Weigh total cost and lifestyle: renovation cost and timeline versus higher upfront price for modern layout and lower maintenance in a new build.
How do I check flood and insurance risk?
What is the best time to list in South Miami?
- Late winter through spring often sees more buyers and stronger list‑to‑sale ratios, but confirm with current neighborhood‑level trends in MIAMI REALTORS data.